
The fastest way of increasing your SaaS sign-up rate is to optimize your conversion funnel through A/B testing.
The changes you make to your website can have a positive impact or completely destroy your conversion rate.
It’s virtually impossible to know if changing a piece of copy will increase your sign-up rate or if it will drive people away.
This is why A/B testing is so important: in case a change you made turns out to perform worst than the original, you can stop the experiment and try something new. But if you implemented that change without testing it, your conversion rate would suffer until you either roll back to the original or change your website again.
I strongly recommend you A/B test all the changes you make.
Don’t worry if you have never ran an A/B test, as by the end of this 5 steps guide you’ll learn how to:
- create a funnel;
- analyze the data;
- create testing hypotheses;
- prioritize the hypotheses;
- create your first A/B test in Google Optimize.
Get the funnel data
The first step in optimizing your SaaS sign-up rate is to figure out what exactly is that you want to optimize: do you want to increase free trial sign-ups or paid plan subscriptions?
Decide on a single conversion goal
A/B tests are basically experiments that you run on your website. An experiment needs a unique main goal, but can also have secondary ones.
Here’s an example:
Say you plan to change your sign-up form. The main goal of this experiment is to increase the number of people that go through all the fields and submit the form.
As a secondary goal, you can track how many people add their phone number.
If your sign-up form has a checkbox for email updates, you can track how many people click on it.
Each secondary goal is unique based on what you plan on testing. But remember, you should always have a single primary goal.
So think of what you try to achieve: increase your free trial users or paid plan subscription? If the latter, do you want to increase the yearly subscriptions or the monthly ones?
Figure out the conversion path
With the goal in mind, go to your website and note down how people can achieve it.
You will have to note down how many people have successfully completed each step (how many viewed a page or clicked on a button).
Here’s an example to better outline the process:
Say you use your homepage as a Landing Page. This will be the first step of the funnel.
Next, you have a “Try now” button in the hero section of your homepage. This will be the second step of the funnel.
The button takes people to your pricing page. This is the third step of the funnel.
Your goal is to increase the free trial sign-ups, so people need to click on the “Try for free” button. This is the fourth step of the funnel.
Users see another page that asks for their email and name. This is the fifth step of the funnel.
Finally, they have to click “Confirm” and they have successfully completed the funnel.
The example above is of a linear funnel, for the sake of simplicity, but people can take multiple paths toward conversion. You should stick with a linear funnel if this is the first time you optimize your website.
Take a second to go through your website and note down each step, then continue reading.
Analyze the funnel data
With the funnel in place, it’s time to analyze how many people complete each step and how many abandon down the road.
Based on these numbers you will create and prioritize testing hypotheses.
Calculate the drop-off rate of each step
The analysis that I am about to show you is done through Google Analytics. If you don’t have it installed, be sure to add it to your website, bookmark this article and come back after 2 months.
You will need at least 2000 users per month in order for this analysis to work.
With that out of the way, let’s jump into it.
Go to your GA account and select the Audience -> Overview report.
Pick a 3-month long period from the date picker.

Click on “+Add Segment” on the top of the page and select “New Segment”.

Go to the “Advanced” tab and click on “Sequences”. Next, be sure to select “Users” under the “Filter”.
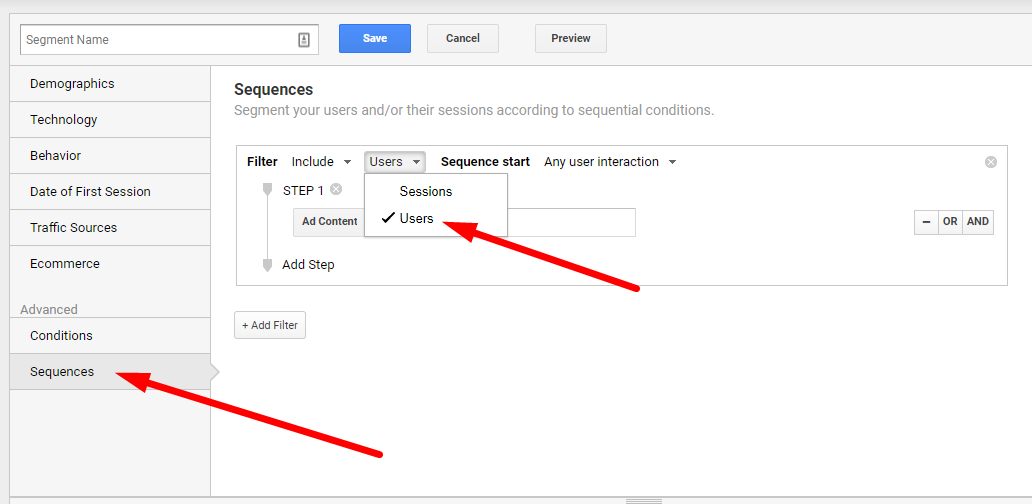
Click on the dimensions dropdown (by default its value is “Ad Content”), type in Landing Page, find it in the list, and click on it.
This will tell GA that you want to segment the traffic based on the page they landed on.

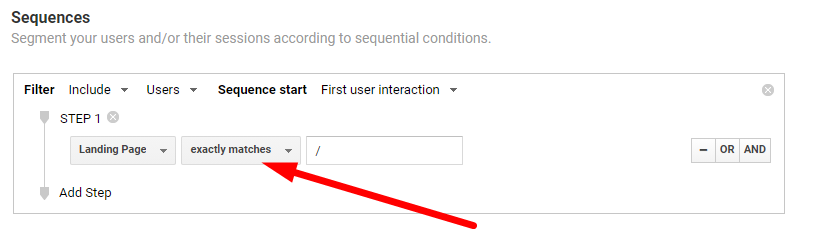
Following my previous example, I will consider this to be the homepage, so I am going to type “/” but not before I select “exactly matches”, otherwise the segment will contain all users.
Give the segment a name and click “Save”. Next, you have to open it up again by clicking on the small arrow in the top right corner and clicking on “Edit”.
Note: a while ago the segment data was updated right while you were creating the segment, it seems like this is not the case anymore.

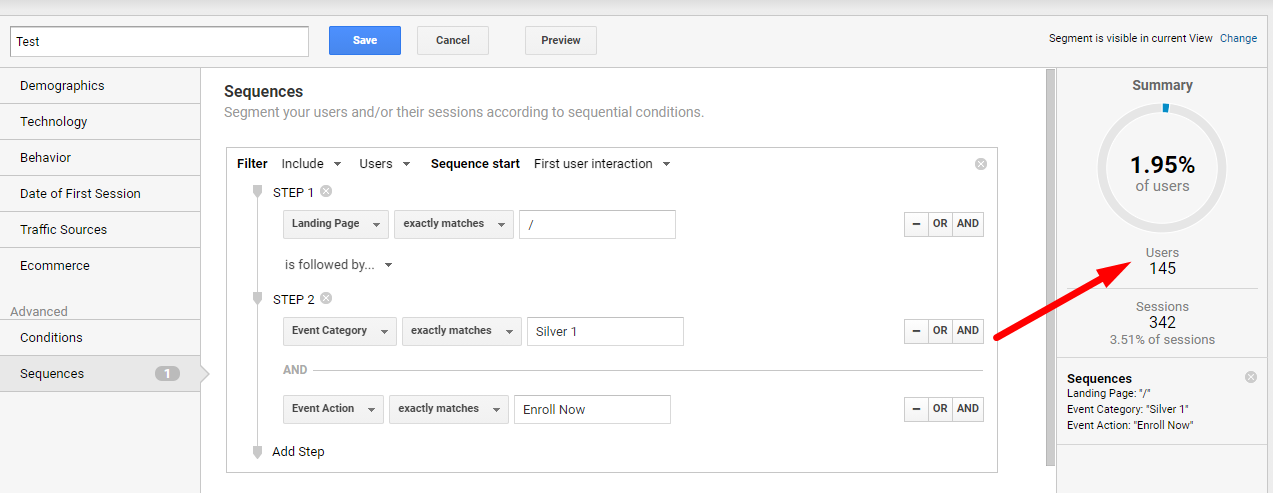
Note down the number of users that are part of this segment (displayed on the right part of the screen) and click on the “Add Step” button.

We know how many users have started this funnel, but we want to know how many of them proceed to the next step.
Following the example above, the second step of the funnel is to see how many users have clicked on the hero section button. For this, I have already created an event.

Click “Save” then “Edit” as you did before. You will now see an updated number of users. This number represents how many of all users have completed both steps of the funnel.
You should continue doing this until finish all the steps of the funnel. Create an additional step and note down the number of users.
Once you are finished, it’s time to calculate the drop-off point of each step.
Simply divide the number of users that reached Step 2 by the number of users that started with Step 1 and multiply by 100.
In the example above, this would be 145/6,796, which is 0.0213*100 = 2.13.
This means that 2.13% of users reach Step 2.
Continue doing these calculations until you have percentages for all steps of the funnel.
Calculate the total funnel conversion rate
I am sure that by now you have a way better idea of what steps are causing the biggest drop-offs.
One last thing you have to do is calculate the overall conversion rate of this funnel.
Divide the number of users that completed the goal by the number of users that started the funnel. Like you did before.
This is the metric you will use to understand the impact of all the experiments you will be doing. If your conversion rate increases, you are doing a great job. If it is decreasing then you have to reiterate and continue optimizing.
Now it’s time to create the actual hypotheses.
Create testing hypotheses
The conversion rate of each step tells you where to start. Obviously, you want to start with the biggest drop-off point in the funnel.
Most users are dropping off towards the end of the funnel. The closer a user is to the end goal, the more likely they are to convert. This is why the conversion rate of each step is such a good indicator of where to start.
The purpose of this guide is to get you started, so I will not go in-depth on how to create testing hypotheses. I will rather give you a few examples based on my experience optimizing SaaS websites for conversions.
Best practices for the pricing page
The Pricing page can be a deal-breaker for users if it doesn’t clearly communicate the product’s value.
A good pricing page shows the user why they should try your product in the first place, so make sure it:
- Features existing customers testimonials;
- Clearly shows how much each plan costs and what it includes;
- Has a “Contact Us” button so users can easily ask questions if they want to;
Best practices for forms
In order for users to reach your desired goal, they will have to submit a form.
You should always make sure that:
- the data validation in your forms is working correctly – if you require a phone number from a specific country, like the USA, keep in mind that people can type it in multiple different variations;
- you are asking for the smallest possible amount of information – no one wants to spend minutes signing up to a platform;
- if your form contains more than 6 fields you should try to break it up in multiple steps – people feel less intimidated if they see a few questions at a time.
Prioritize improvements
By this point, you already have a few testing ideas. Now I want to show you how to prioritize them using the PIE framework.
Prioritization is extremely important as for each step of the funnel you might have multiple ideas of improvements. At the same time, as a SaaS owner, you want to spend your precious time wisely and get the most out of everything you do, testing included.
This is why I want to teach a simple and to-the-point prioritization framework.
The PIE framework
PIE stands for Potential (of improvement over existing conversion rate), Impact (on existing traffic on the testing page), Ease (of implementation).
Here is a Google Sheets template that you can copy just by clicking on this link: https://docs.google.com/spreadsheets/d/13dGBDk3zwdSN7DvFuC2hwt_CKez6tTNZ3mVqGUpDcic/copy
It’s pretty easy to complete and it will also act like your Testing Masterfile – a place where you can keep track of all your experiments and ideas as well as prioritize them.
The first columns are pretty self-explanatory, so let’s jump straight to the PIE framework.
For each one of the 3 columns associated with the framework, you will have to rate the hypotheses on a scale of 1 to 10. Then simply calculate the average and you will get the testing score.
The higher a testing score is, the faster you should test that hypothesis.
Potential
The Potential represents the improvement over the existing conversion rate.
If you have a crappy form and are just launching a new and improved one as a test, then you would want to give it a score of 10.
Alternatively, if you plan on testing a different color for a button then the Potential would be close to 1.
Impact
The Impact represents how valuable your traffic that lands on the testing page is.
Basically, if you want to run a test on your pricing page, you should give it a score of 10, as it’s the main conversion page in the funnel.
Alternatively, if you plan on running a test on the About Us page that doesn’t get too much traffic you should give it a score closer to 1.
Ease
The Ease represents how easy the test is to implement.
If your test is going to be extremely hard to implement you should give it a score closer to 1.
Alternatively, if you are going to change a headline then you can give it a score of 10.
Start testing
With the Testing Masterfile completed and all hypotheses prioritize, it’s time to get your hands dirty and start testing.
The fastest and easiest way to run a test is by using Google Optimize. Not to mention it’s completely free.
I am going to show you a simple example of how you can create your first redirect test. This type of test relies on a separate page that you have created on your domain and will just redirect a percentage of people towards it.
Quick guide to Google Optimize
Before you can start using Google Optimize, make sure you create an account and install the snippets on your website.
Once you do that, go to optimize.google.com and select “Create experience”

Give the test a descriptive name, preferably the same one you have already added in the Testing Masterfile. Don’t forget to select the “Redirect test” type. Once you are done click “Create” or press Enter.

For the sake of simplicity, I am going to presume you want to run a test on your homepage. Once you have your new homepage ready and published, click on the blue “Add Variant” button at the top of the page and just copy paste the new URL in the “Redirect” field.
Click “Done” in the upper right corner after you have added the link.

In order to start the test, you will have to connect Google Optimize with Google Analytics Property and View.

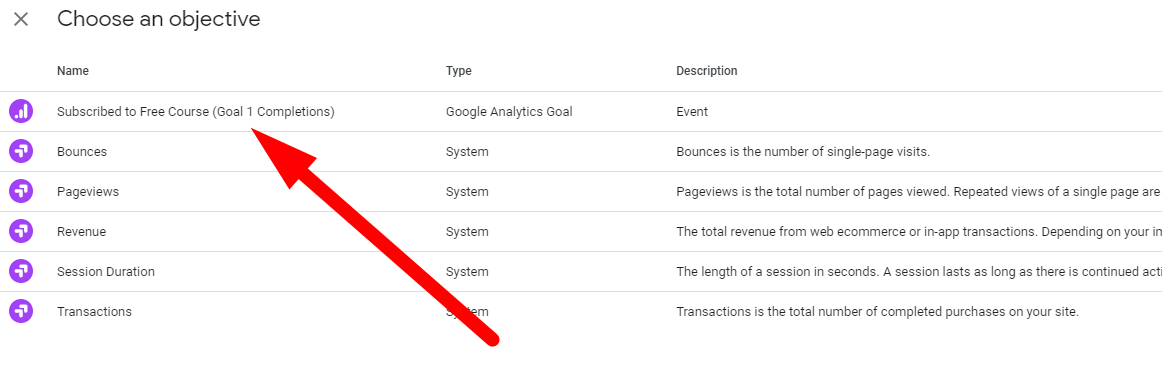
Right below that, you will have to select an experiment Objective. Remember, you have the main goal and multiple secondary ones, so pick your main conversion goal.

For this example, I am going to pick an existing Goal that I’ve already created in Google Analytics, but you can go with whatever makes the most sense for you.
Just one more step before you can launch the experiment: make sure the Google Optimize code is properly installed on the website by clicking on the “Check Installation” button.

If everything is working as expected, you can simply scroll back up and click on the “Start” button in the top right corner.
Congratulations! You just started your first experiment.
A/B testing is a never-ending process, there are always going to be better or worst alternatives to your existing pages, but you will never know unless you test.
If you need any help with any of the above don’t be afraid to get in touch with us by clicking on the button in the menu.